The survey is conducted by the use of a short form questionnaire to WOO members and OOH associations across the world and represents the most comprehensive survey of OOH expenditure globally, says WOO.
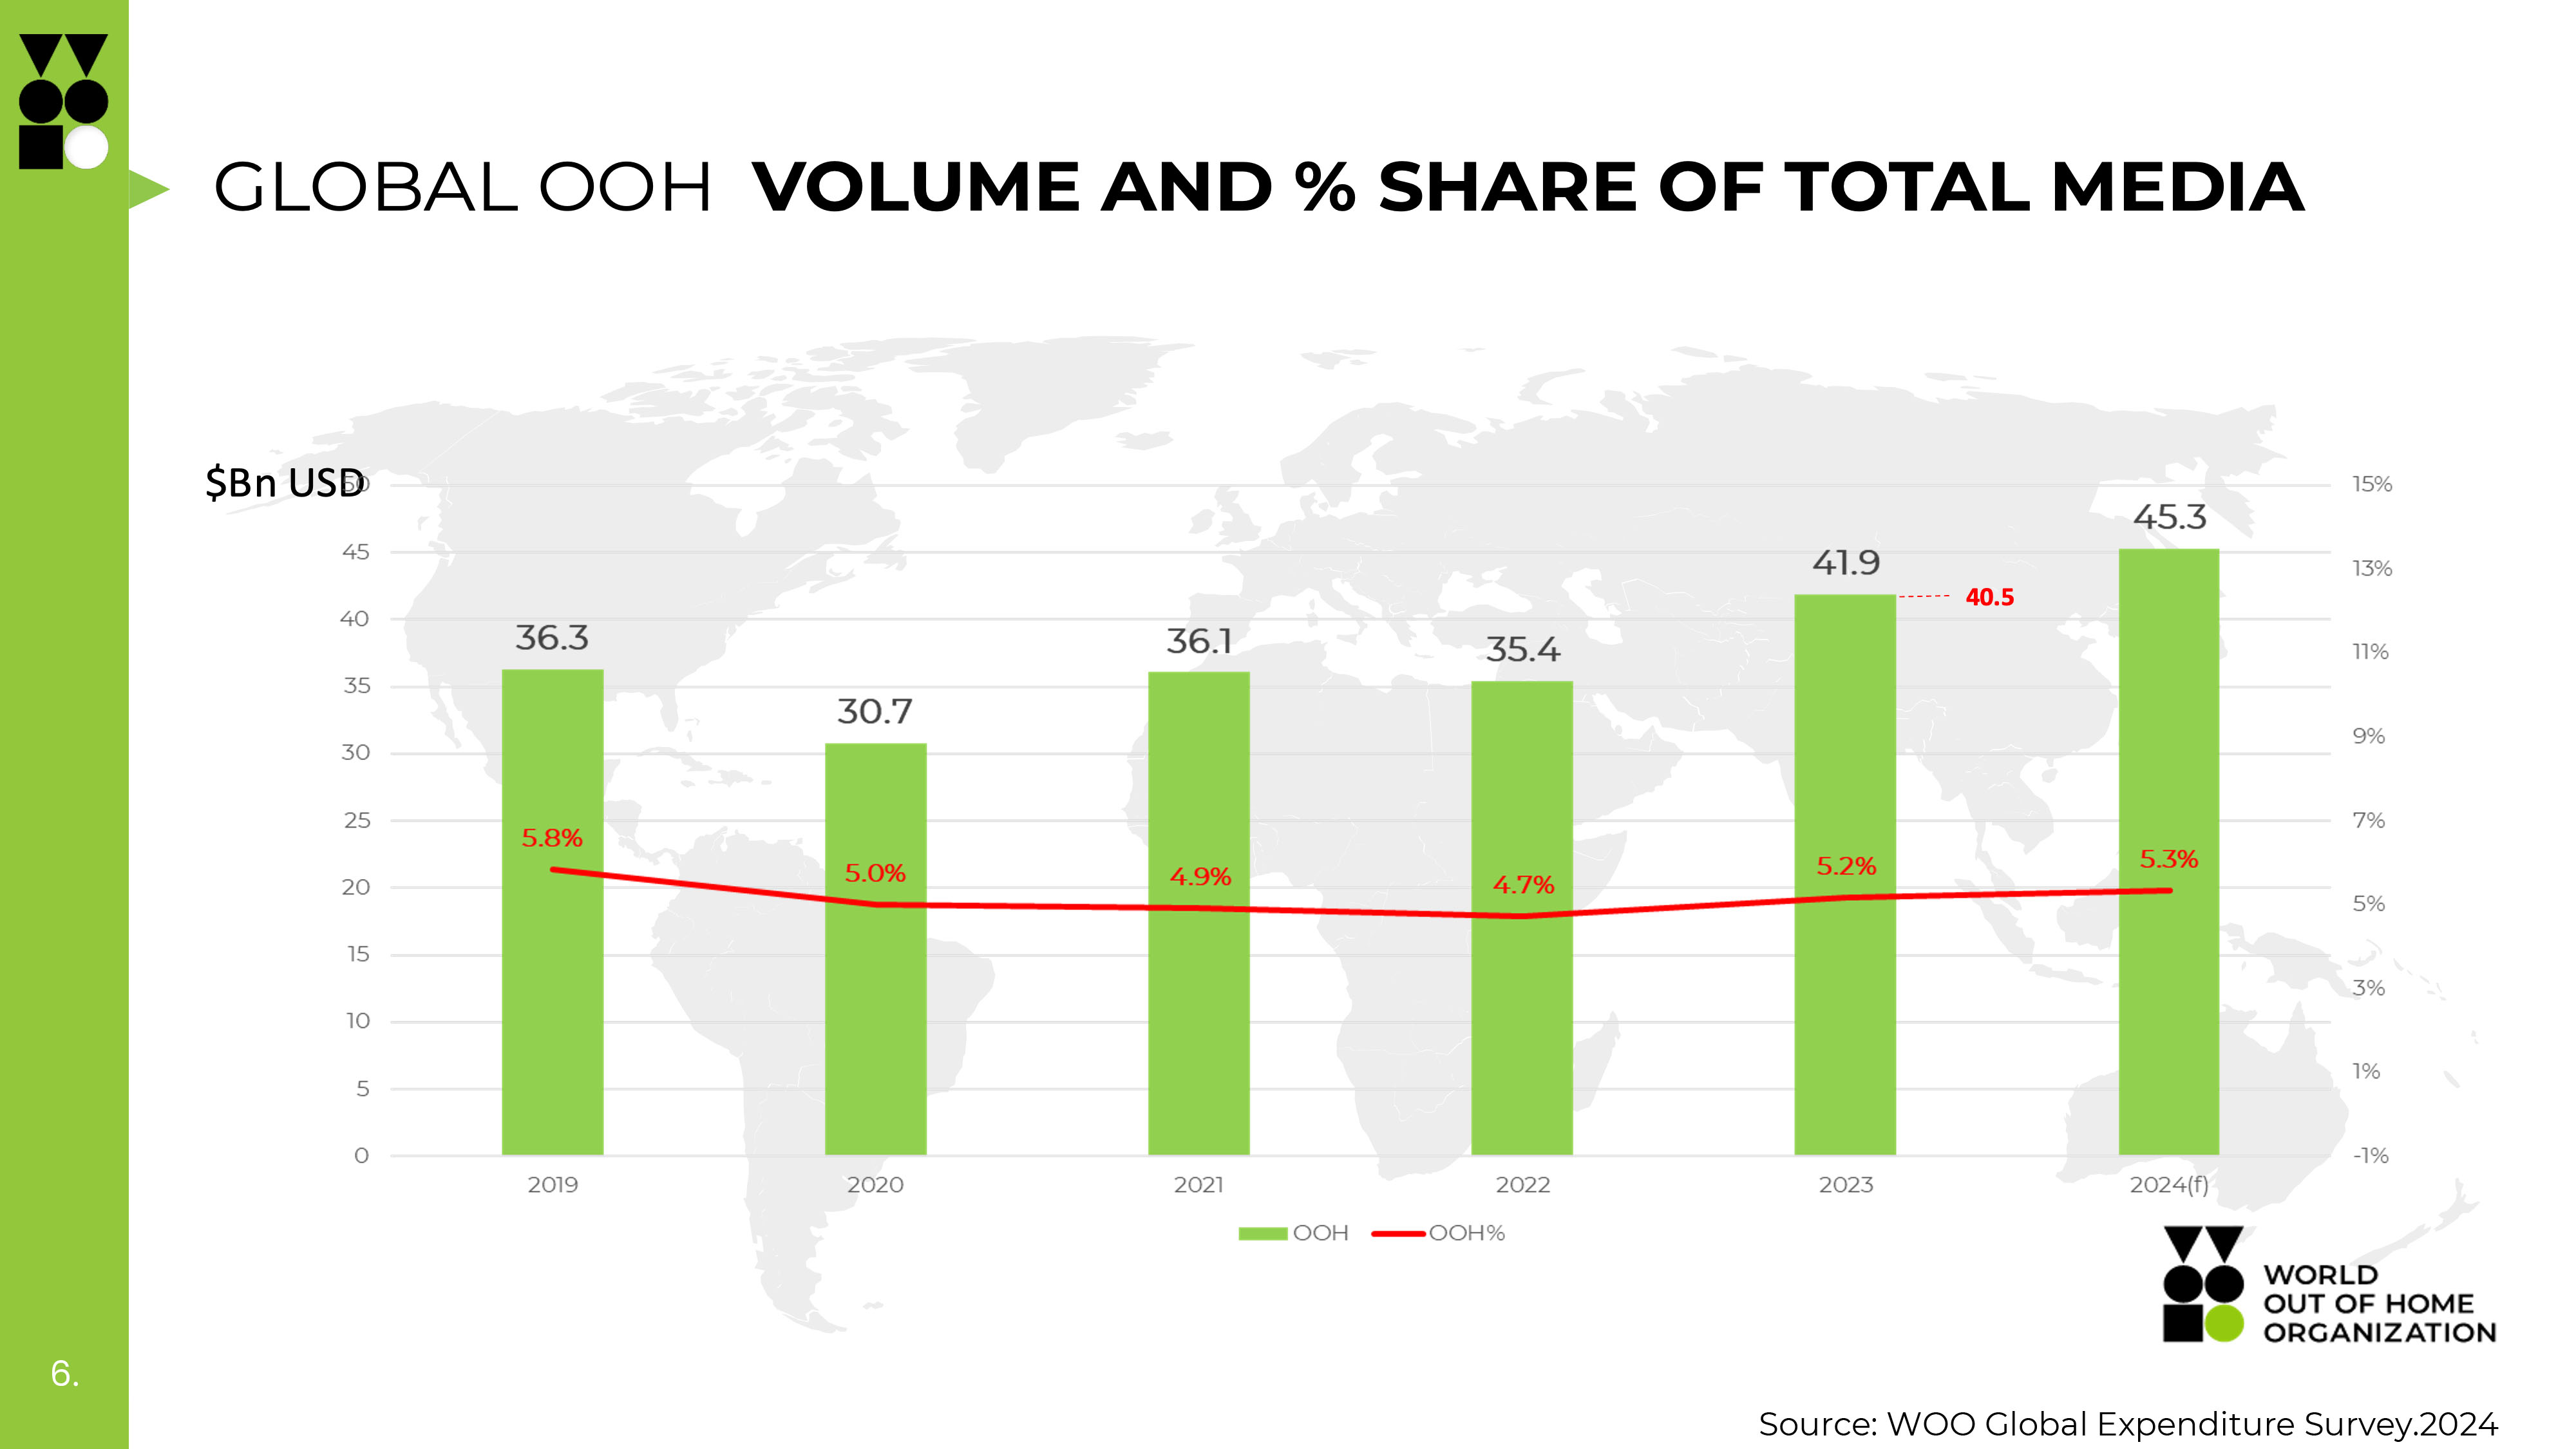
Building on data for each year back to 2019, the WOO Global Expenditure survey allows WOO to track the effect of and recovery from the Covid-19 pandemic alongside local economic conditions and the investment into Digital Out-of-Home (DOOH) as it drives growth for OOH globally.
Understanding these drivers of growth in particular markets allows WOO members and OOH Trade Associations to look to other markets for learnings to drive growth in their own markets, says the organisation.
The 2024 survey was completed by 109 members, covering 85 unique territories — collectively representing 95% of the global GDP and 78% of the global population. Unreported territories are modelled from similar territories based on population and GDP per capita where possible, or are excluded from the study, says WOO.
According to WOO, global expenditure includes the following:
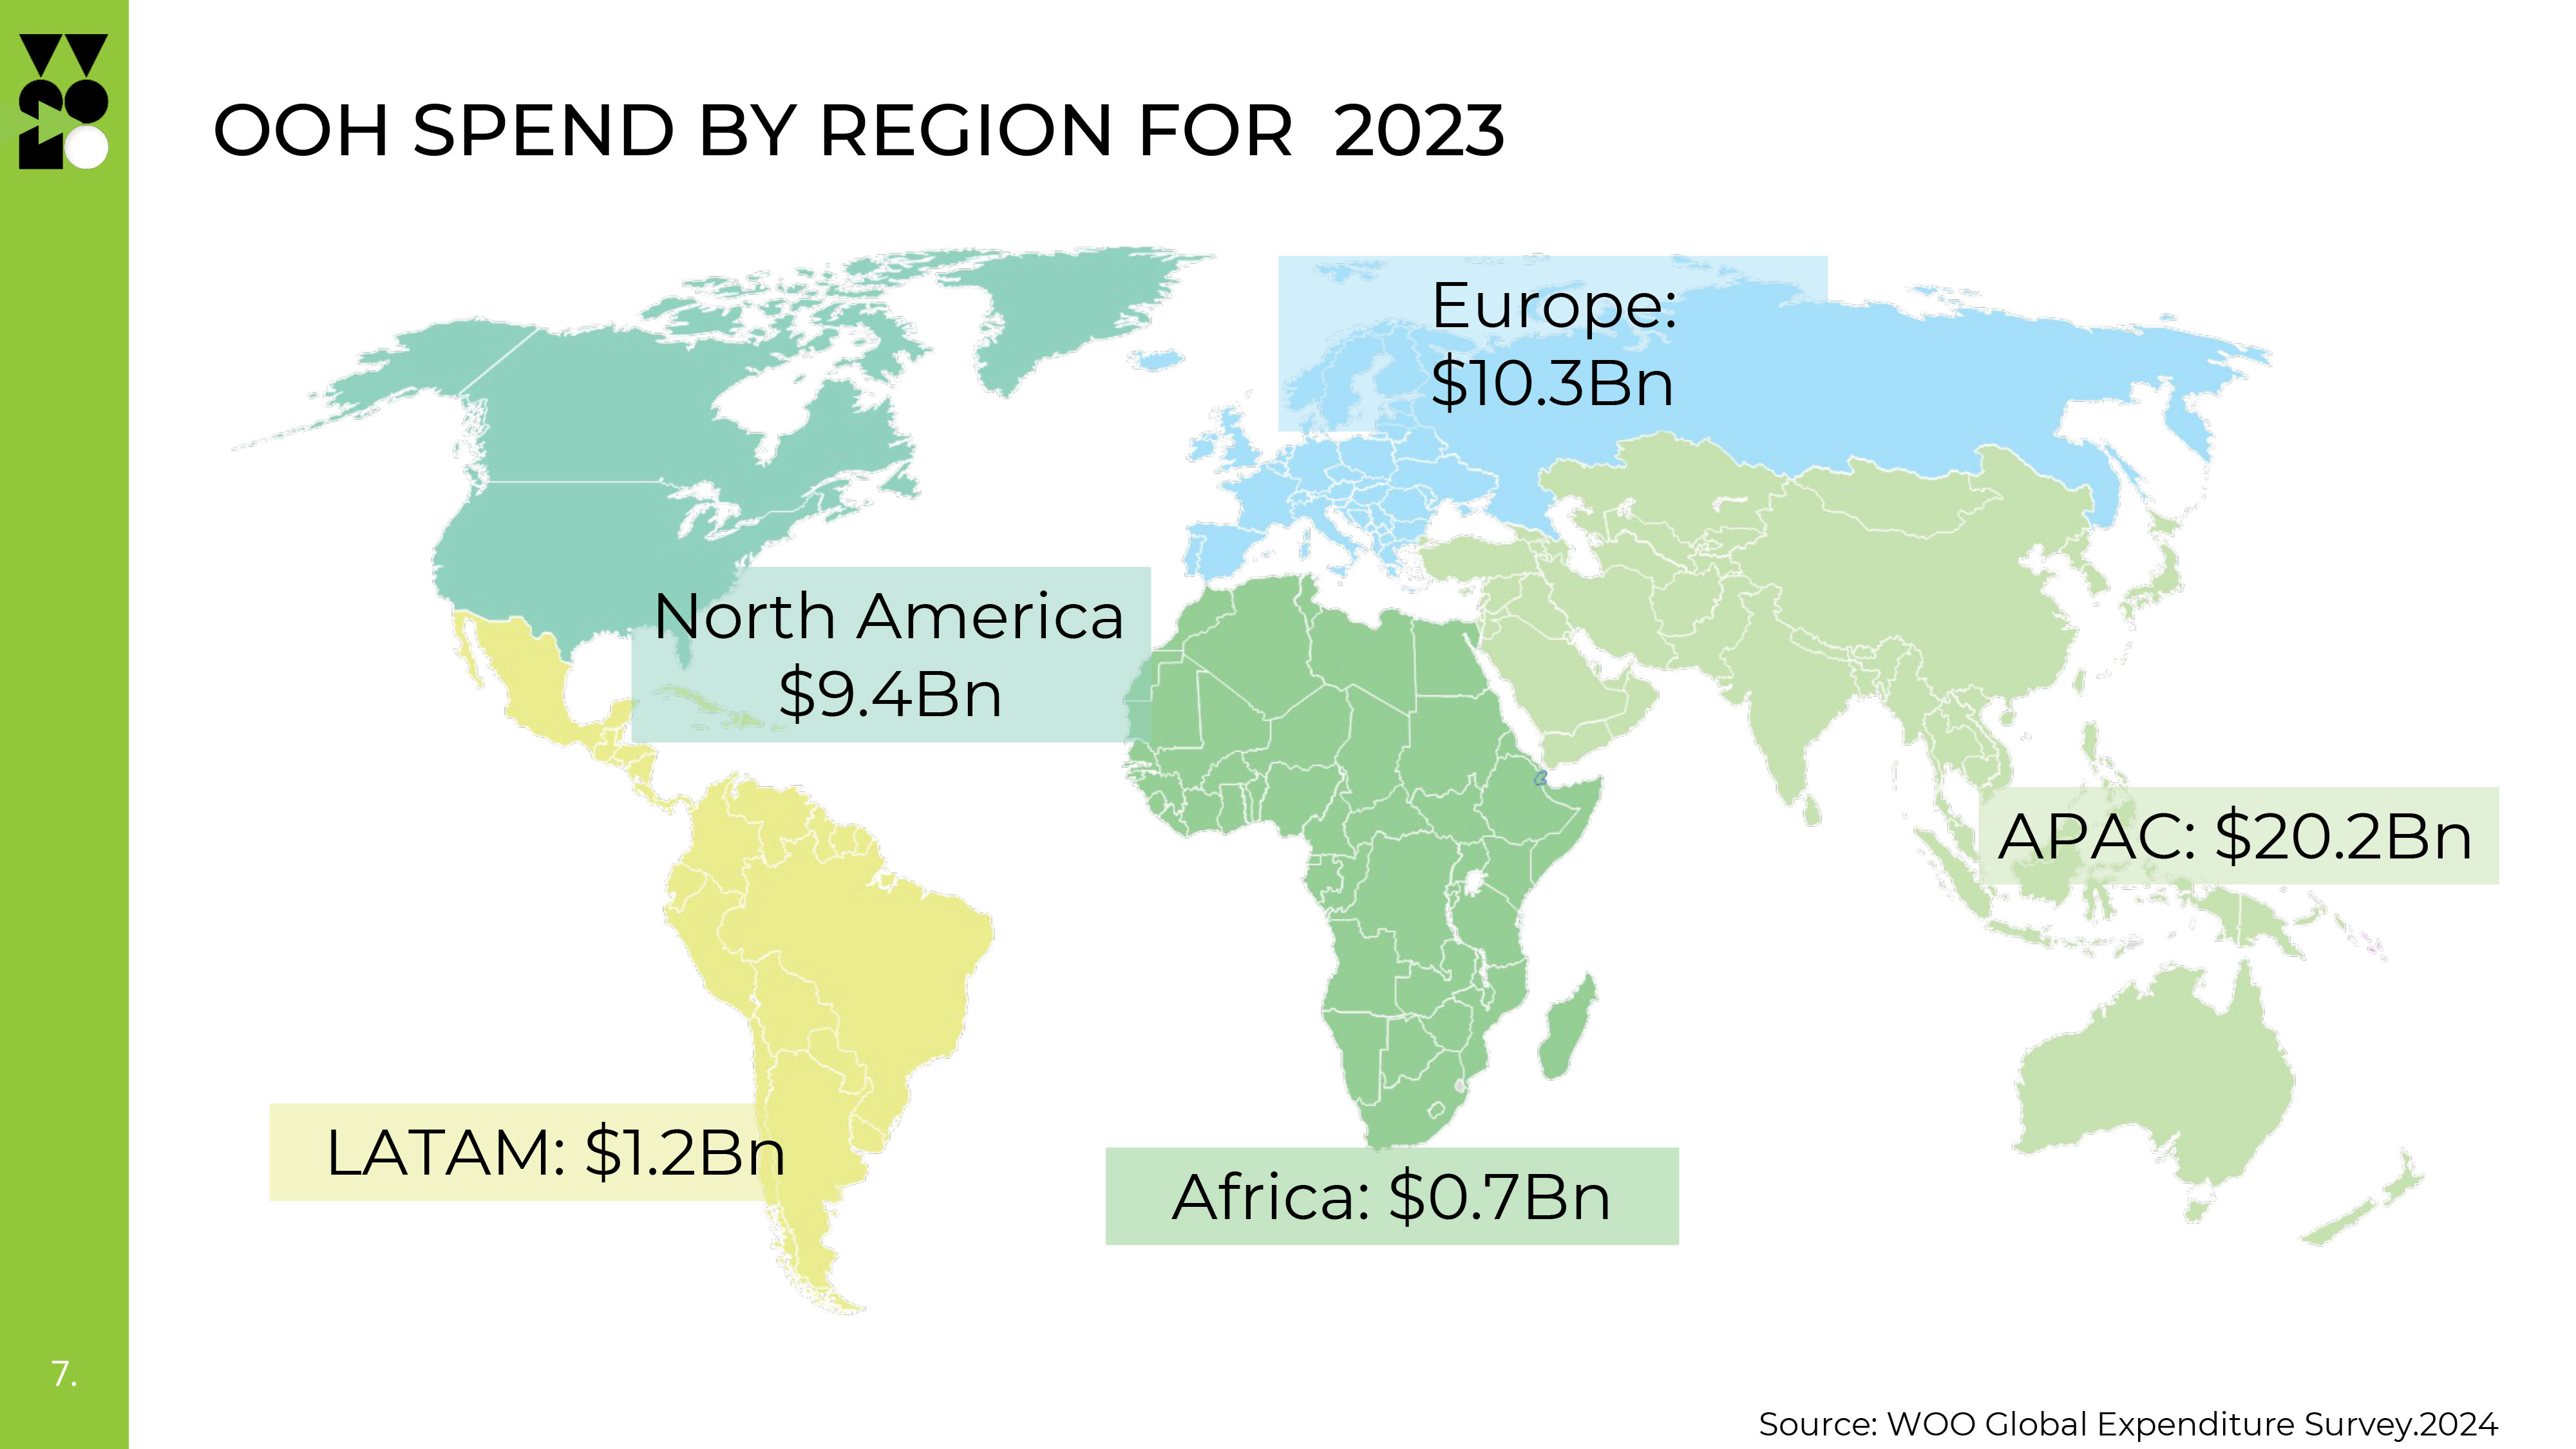
- Asia Pacific dominates with almost half of global OOH spending at USD$20.2-billion across 40% of the global GDP.
- Europe reports USD$10.3-billion revenue, 25% of the total in line with its share of global GDP.
- North America spent USD$9.4-billion on OOH.
- LATAM spent USD$1.3-billion.
- Africa spent USD$0.7-billion track behind their share of GDP — although expenditure reporting in Africa is more challenging and is likely to be under-reporting much of the informal economy.
Global DOOH expenditure rose to USD$16.7-billion in 2023, representing almost 37% of all OOH revenues and remains the main driver of OOH revenue growth globally, says WOO.
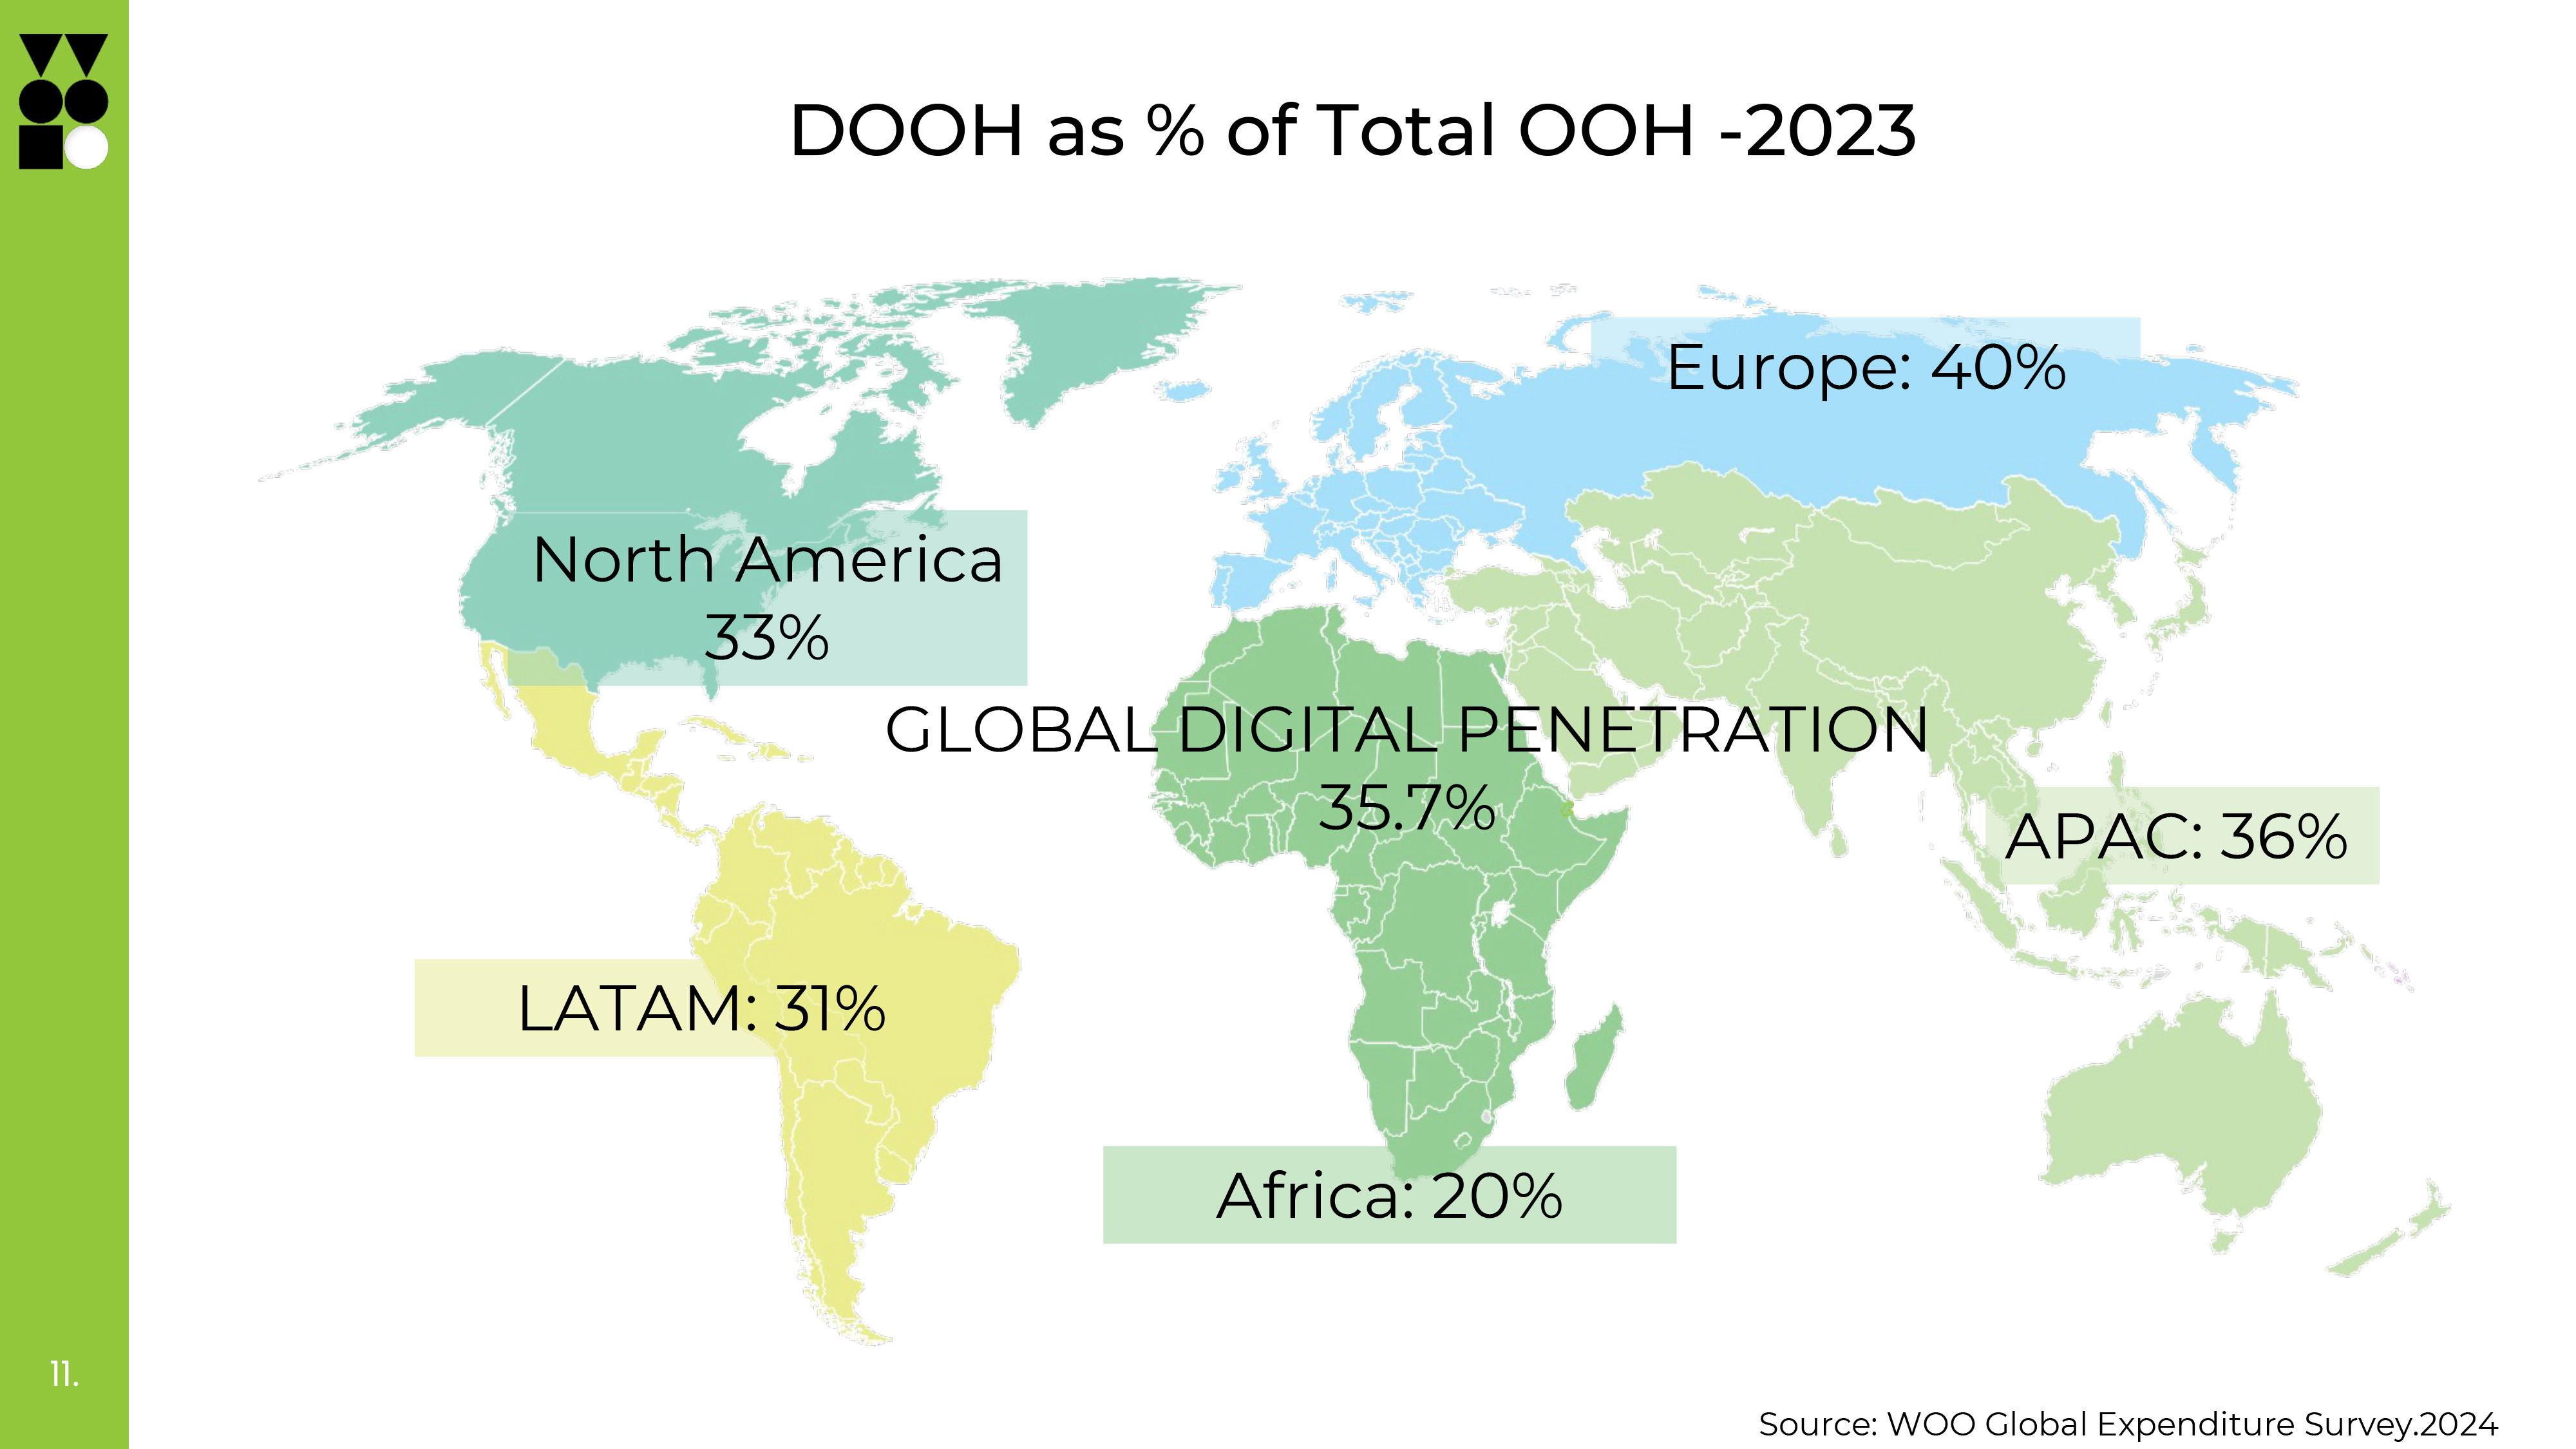
Investment in DOOH infrastructure varies across the world. The total OOH revenues are as follows:
- Europe is ahead of the global average at 39.2%.
- Asia Pacific is just under the average at 36.1%.
- North America is at 32.9%.
- LATAM is at 31%.
- Africa is at 20.1%.
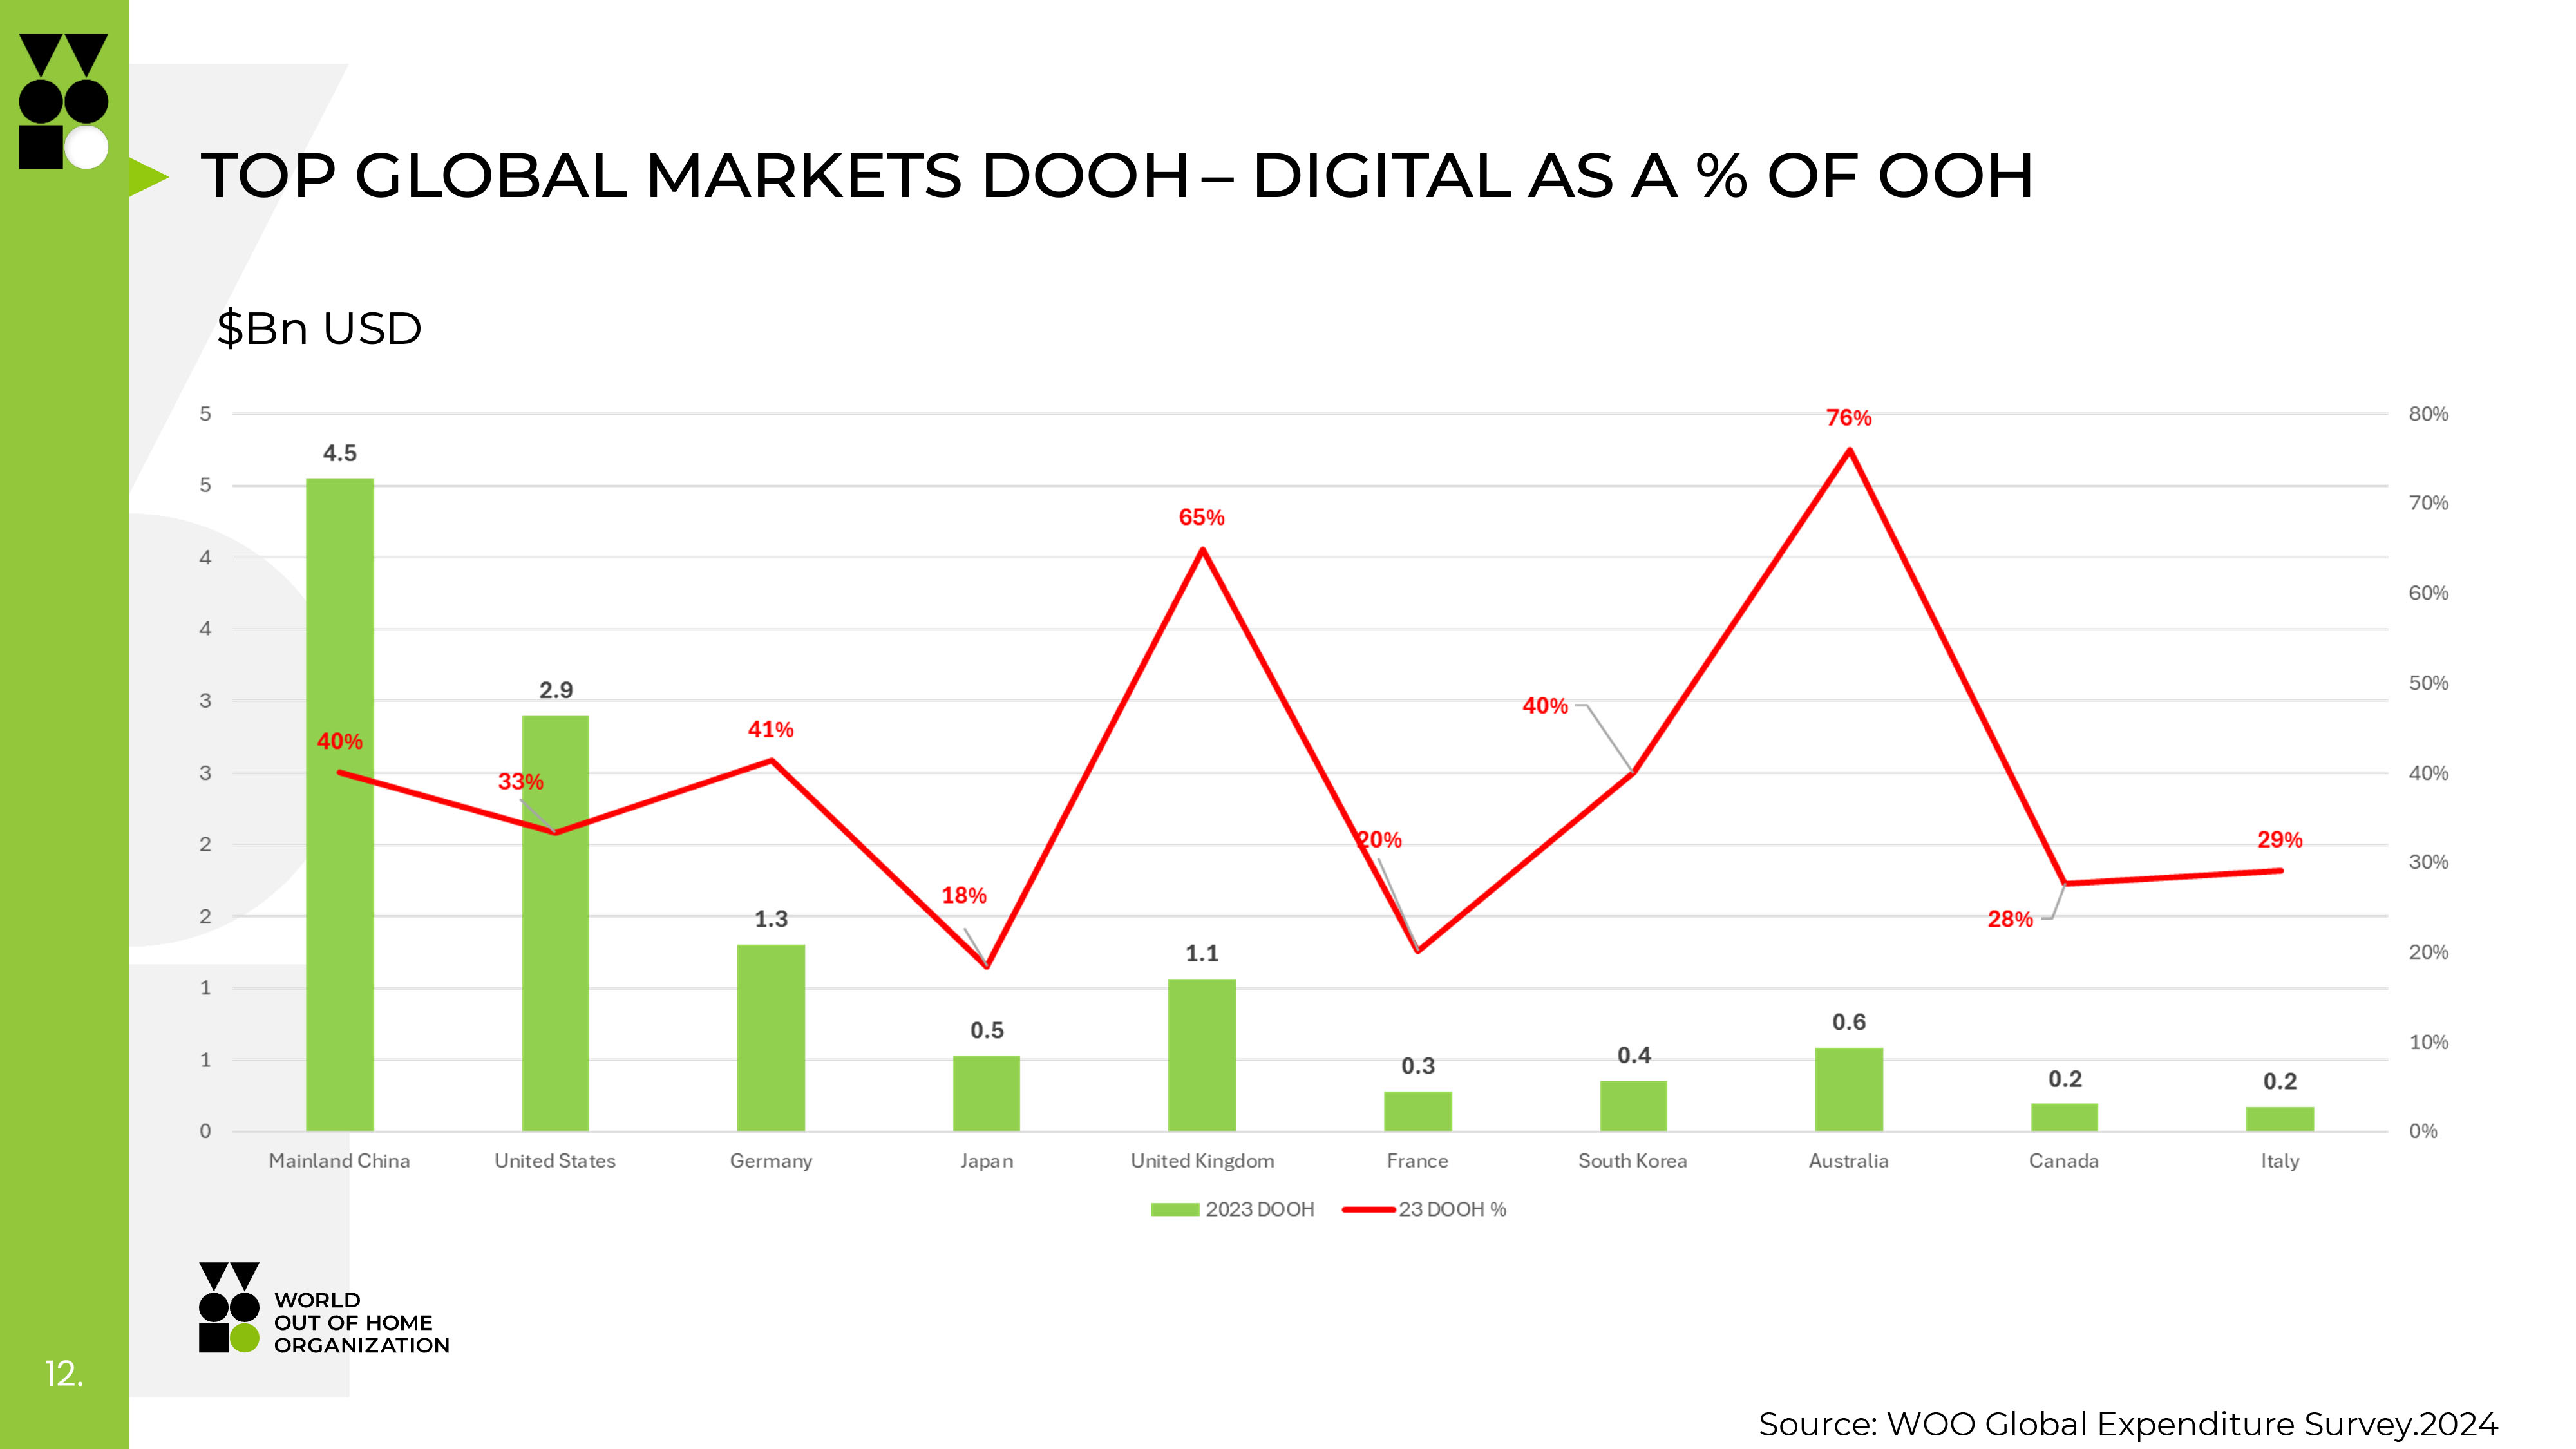
According to WOO, the 'headroom' for growth in DOOH is exemplified by territories that have invested heavily in DOOH screens — of the top 10 markets by overall OOH volume, five lead the way:
- Australia —76% of OOH revenue
- the United Kingdom — 65%
- Germany — 41%
- China — 40%, and
- South Korea — 40%.
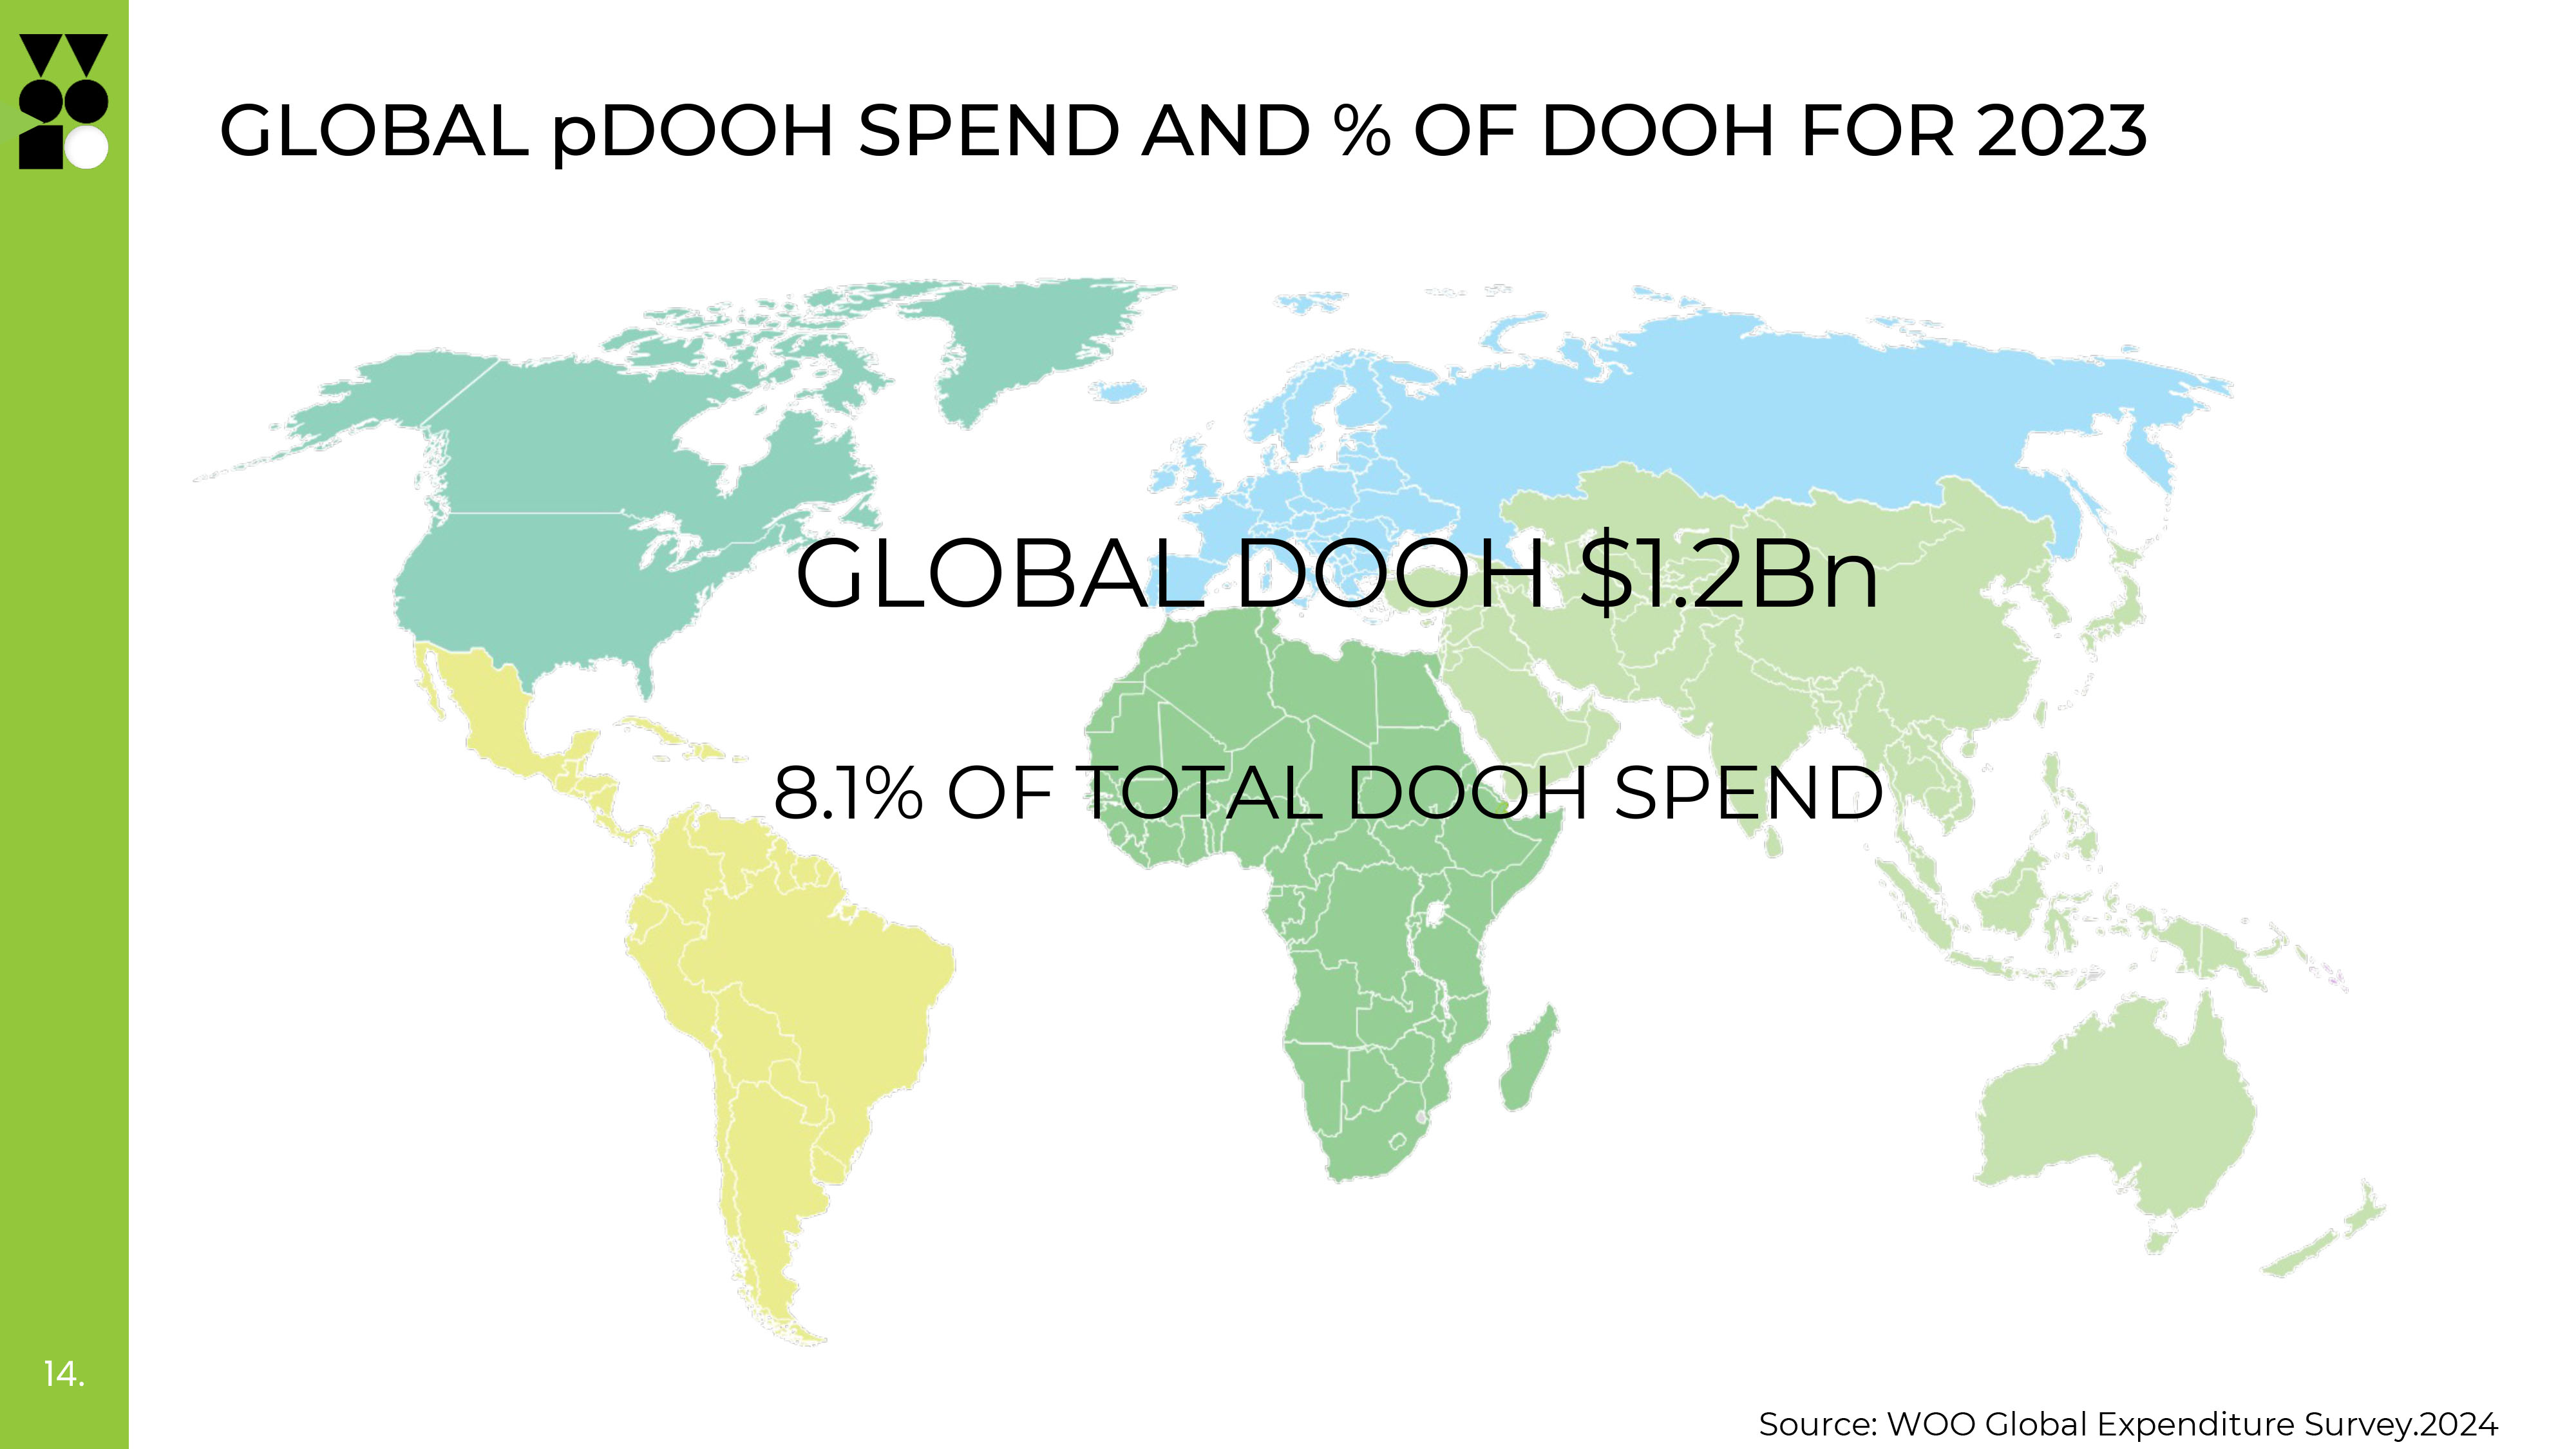
Programmatically traded DOOH grew to a reported total spend of USD$1.2-billion globally, representing 8.1% of total DOOH revenues.
Although this data is not captured commonly across all markets, so it may be under representative of the total revenue traded this way.
WOO says that it anticipates significant growth to this figure in the 2025 report through a combination of increasing market adoption and more comprehensive reporting on programmatically traded revenue.
The WOO Global Expenditure Survey is only possible through the collaboration of WOO members from across the world, and WOO says that it thanks its members for their contributions to this survey.
WOO concludes that geographical granularity and data spanning from 2019 to 2024 is available to all WOO members via the members area of its website, which can be accessed here.
For more information, visit www.worldooh.org or contact Richard Saturley at richard@worldooh.org.
*Image courtesy of contributor